
Book a walkthrough and we'll show you how it applies to your own content.
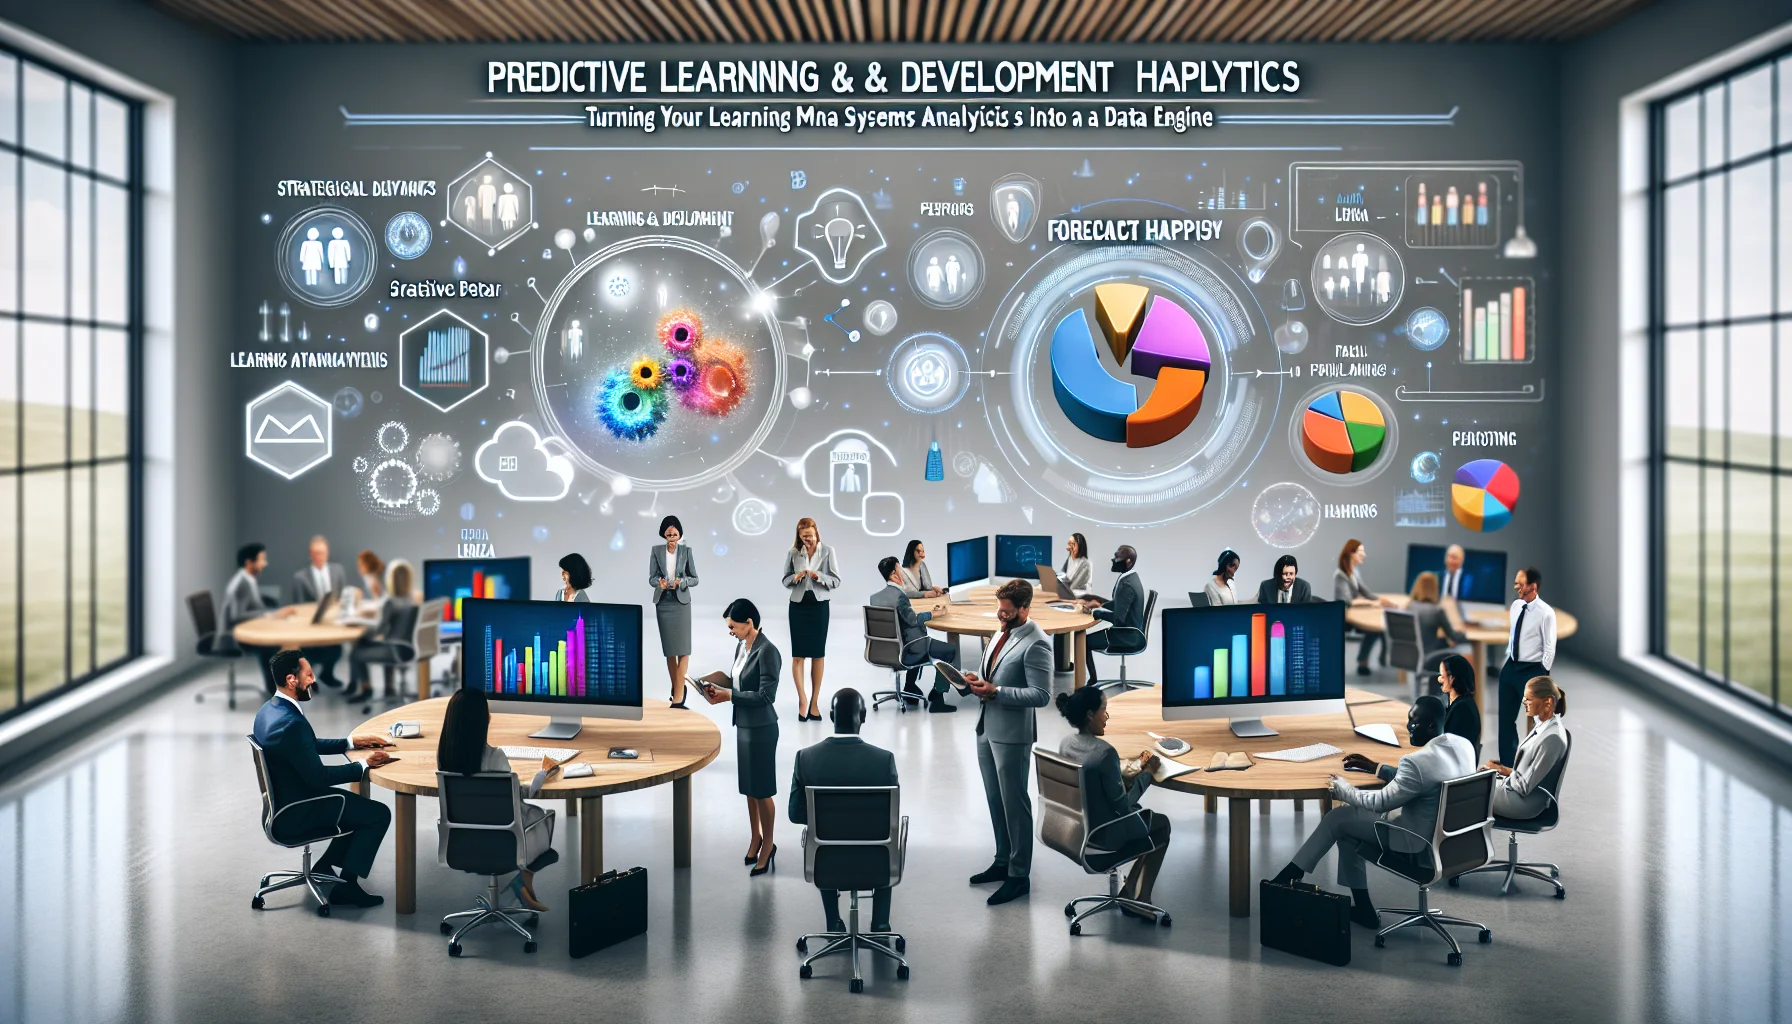
This article shows how predictive L&D analytics maps LMS telemetry and Experience Influence Score inputs to forecast employee happiness. It explains three model classes (logistic regression, random forest, survival analysis), key feature types, validation metrics, and a practical implementation checklist to operationalize forecasts into coaching and governance.
In our experience, predictive L&D analytics is the single most actionable lever L&D and people teams have to move the needle on culture and retention. This article explains how predictive models map Learning Management System (LMS) and Experience Influence Score (EIS) inputs to forecast employee happiness, what modelling approaches work, and how to operationalize predictions into coaching, design and governance.
We focus on practical, non-technical explanations, sample features, validation metrics, and a concise implementation checklist teams can use to bring predictive L&D analytics into board-level reporting.
Predictive L&D analytics turns descriptive dashboards into forward-looking signals. Instead of reporting that average engagement fell after a training cohort, teams can forecast which cohorts or individuals will show lower happiness scores and intervene early.
That forward view gives HR leaders a way to tie learning investments to measurable outcomes: happiness, engagement and ultimately turnover risk. The Experience Influence Score (EIS) becomes a dynamic input to workforce planning, not just a retrospective metric.
Different business questions require different model families. We've found that a pragmatic stack covers three use cases: binary happiness prediction, nonlinear feature interactions, and time-to-event forecasting.
Below are approachable descriptions of each model class and when to use them.
Logistic regression predicts a probability that an employee will fall above or below a happiness threshold. It's easy to interpret: coefficients show the direction and magnitude of influence. For EIS inputs this means you can say "completion of course X is associated with a 12% uplift in happiness probability."
Use logistic regression when you need explainability, low computational cost, and a clear baseline for business stakeholders.
Random forest is an ensemble of decision trees that uncovers complex patterns between LMS behavior, EIS inputs and happiness. It often improves accuracy where relationships are non-linear or when interactions (e.g., course type × manager support) matter.
We recommend random forest when predictive performance is a priority and you combine it with interpretability tools (feature importance, SHAP) to avoid a black-box outcome.
Survival analysis models the time until an event, like a sustained happiness decline or voluntary exit. This approach is valuable when you want to forecast not only "if" but "when" an intervention is needed.
Survival methods complement binary models; use them when resource planning requires a timeline for coaching or re-skilling.
Feature design is where predictive L&D analytics delivers the most lift. We focus on signal engineering that links learning behaviors and experience metrics to happiness outcomes.
Sample features fall into three buckets: learning content and engagement, social and managerial signals, and contextual HR attributes.
Good features combine LMS telemetry with qualitative EIS inputs. For example, a low satisfaction rating combined with stalled course progress is a stronger predictor than either alone.
Validation ensures predictions are reliable and actionable. We recommend a three-pronged validation approach: statistical performance, calibration, and business impact.
Key metrics and checks include:
To maintain trust, retrain models on fresh data regularly, monitor for drift in feature distributions, and report uncertainty ranges to stakeholders.
Operationalizing predictions into the LMS and HRops workflow requires clear steps. Below is a short checklist we use with clients to fast-track production deployments.
Tip: include an ethics review and privacy check before using personal or sensitive EIS inputs in production models.
A pattern we've noticed is that early-warning signals from LMS behavior combined with EIS ratings reliably predict near-term happiness dips for mid-career contributors. In one pilot, a logistic model using course engagement, sentiment on reflective tasks, and manager touchpoints flagged 12% of the population as high risk.
Some of the most efficient L&D teams we work with use platforms like Mentora LMS to automate this entire workflow without sacrificing quality. They routed high-risk flags to a coaching queue, where trained coaches focused on role-fit conversations and micro-learning nudges.
Within three months the pilot group showed a 20% reduction in sustained low-happiness episodes and a correlated drop in voluntary exits. The key success factors were quick feedback loops, clear coach playbooks, and transparent model explanations for managers.
Predictive L&D analytics can amplify bias if not guarded. We've found these risks most common:
Mitigation strategies we recommend include fairness audits, dropping or reweighting problematic features, and using explainability tools (coefficients, SHAP values) to produce human-readable rationale alongside each prediction. For executive reporting, present both predictive performance and interpretability findings together.
Predictive L&D analytics converts the Experience Influence Score from a descriptive KPI into a strategic predictive signal that boards and HR leaders can act on. By combining interpretable models like logistic regression, higher-capacity models like random forest, and time-based survival analysis, teams can forecast happiness outcomes and prioritize interventions.
Start small: pick a measurable outcome, build a minimal feature set, and pilot one intervention channel (coaching or micro-learning). Track uplift with A/B or holdout groups, and iterate. Over time, integrate predictions into workforce planning and board-level reporting to show tangible ROI from learning investments.
Next step: run a 90-day pilot that uses the checklist above, measure calibration and uplift, and present results in the next People & Talent review. That practical pilot is the fastest path from model to happier employees.
The Mentora LMS Team provides actionable insights on technology and business strategy.
 Business Strategy&Lms Tech
January 26, 2026
This article explains predictive HR analytics using LMS data to forecast outcomes like attrition, promotion readiness, and performance. It covers feature engineering, model selection (from logistic regression to sequence models), evaluation metrics and interpretation, plus ethics, bias mitigation, deployment patterns, and a governance checklist to run a safe, explainable pilot.
 HR & People Analytics Insights
January 6, 2026
Step-by-step, this article shows how to calculate an L&D happiness metric using an Experience Influence Score that combines normalized survey deltas, behavioral engagement, sentiment analysis, and performance deltas. It includes cleaning rules, weighting strategies, a spreadsheet template, validation checks (Bayesian shrinkage) and a mini sales training case.
 Lms
LmsDecember 28, 2025
This article shows how managers can use LMS analytics wellbeing to detect stress and disengagement early by tracking a compact KPI set, tuned alerts, and a concise dashboard. It recommends humane outreach scripts, privacy guardrails (consent, minimal data, role-based access), and a five-step pilot to implement alerts and measure outcomes.
 Business Strategy&Lms Tech
January 28, 2026
This article presents a conservative, repeatable framework to calculate wellbeing training ROI for LMS programs. It details cost templates (development, licensing, admin, opportunity cost), benefit models (absenteeism, turnover, productivity, EAP), two worked examples with sensitivities, and practical guidance for collecting HR/finance inputs and improving attribution.